This post is provided for illustration purposes. We welcome any feedback at d3fend@mitre.org
- Peter Kaloroumakis
Introduction
With D3FEND, we aim to bridge the gap between architectural systems engineering and the granular technical details required for cybersecurity detection engineering. For example, consider the detection logic necessary to identify kernel-level system call execution chains. We believe that D3FEND CAD can serve as a powerful resource to fill this gap, powered by D3FEND’s ontology and knowledge base.
In our previous blog post, we introduced D3FEND graphs and the many features of CAD. In this post we focus on the process and methodology behind creating impactful D3FEND graphs in CAD. In addition, we provide a D3FEND graph example of the ShadowCat attack, which serves as a useful reference, especially for those users in Cyber Threat Intelligence (CTI) Analysis and Incident Response roles. Before diving into domain-specific approaches, we’ll first establish the foundational building blocks of this process.
Building Effective Graphs
Starting Point
A D3FEND graph created in CAD is built using the following main components:
Node
Description
Example
Digital Artifacts
A cyber-related object that an action or another object interacts with
File
Attack Actions
An action taken or planned by attackers, aligned to an offensive model
T1190: Exploit Public-Facing Application
Defensive Actions
An action taken or planned by defenders, aligned to D3FEND techniques
Disk Encryption
Relationships
Links between nodes defined by the D3FEND Ontology
mitigates
Accordingly, creating effective D3FEND graphs in CAD starts with these key steps:
Identifying the D3FEND classes that should be used for the nodes.
Adding precise D3FEND relationships between the different node types.
More details on building out D3FEND graphs in CAD can be found in our previous blog post.
It’s important to note that the high-level process for building D3FEND graphs varies by domain, skillset, and objective. For example, consider CTI Analysts or Incident Responders. These users typically begin by examining the actions taken by an adversary, making the modeling of attack actions a logical first step. Next, they typically analyze the entities that were affected by the adversarial actions, before finally making mitigation recommendations.
        flowchart LR;
    A(Model Attack Actions) -->
    	B(Model Artifacts) -->
		C(Model Defense Actions);
    class A OffensiveTechniqueNode;
    class B RootArtifactNode;
    class C DefensiveTechniqueNode;
CTI Analysts & Incident Responders: Begin by modeling Attack Actions, followed by Digital Artifacts and Defense Actions.
Security Architects or Systems Security Engineers, on the other hand, may take the reverse approach. They begin with an understanding of their assets and mitigations in place already, and are primaliry concerned about how these may be attacked. Therefore, their first step would likely be the modeling of defense actions, followed by digital artifacts and then attack actions.
class A OffensiveTechniqueNode;
class B RootArtifactNode;
class C DefensiveTechniqueNode;
Security Architects & Systems Security Engineers: Begin by modeling Defense Actions, followed by Digital Artifacts and Attack Actions.
This iterative process ensures the development of a well-rounded and insightful D3FEND graph. It’s worth noting that CAD includes additional node types, such as Events, and that starting from nodes other than “Attack Action” or “Defense Action” may be appropriate for different use cases. However, we’ll explore these scenarios in a future post. In the next sections, we examine in detail each modeling step involved in making a D3FEND graph.
Modeling Attack Actions
When addressing threats and adversaries, a common starting point is modeling Attack Actions. In CAD, Attack Action classes are typically represented by an Action node with an ATT&CK TTP identifier. Many Cyber Threat Intelligence (CTI) reports conveniently include an appendix of TTP IDs or embed them directly within the content, simplifying the process of integrating these identifiers into D3FEND graphs.
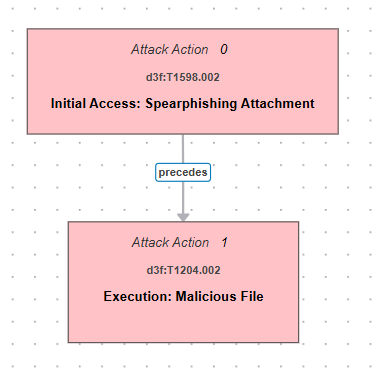
One challenge that practitioners may encounter is organizing Attack Actions in a logical, chronological sequence - this may require careful analysis of CTI. To communicate this effectively, we establish relationships between sequential Attack nodes using the “precedes” relationship. This approach ensures that a D3FEND graph contains clear and structured representation of the attack timeline, enabling better analysis and response planning.
A D3FEND graph showing 'Initial Access: Spearphishing Attachment' occurred before 'Execution: Malicious File'
Modeling Defense Actions
In CAD, Defense Action nodes apply D3FEND countermeasures (and therefore make use of the Countermeasure node type). Modeling defensive actions may be a good starting point for defensive cyber operators who know the answers to questions such as:
What defensive systems do we have?
What are my defensive systems capable of?
What are my defensive operators capable of?
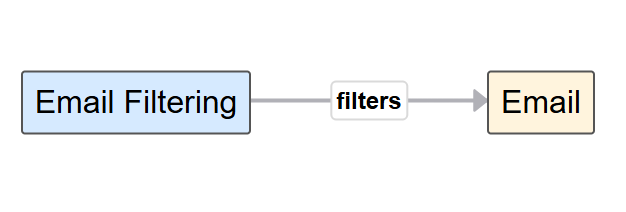
Given a defensive action, one can use CAD to help understand the digital artifacts that are associated with the action. To do so, right-click on a blue Defense Action node in CAD and select “artifacts”. For more information on node inferences in CAD, refer to Section 3.3 of the CAD User Guide.
Through CAD, the "filters d3f:Email" edge will auto-populate when selecting "Artifacts" after right-clicking a Defense Action
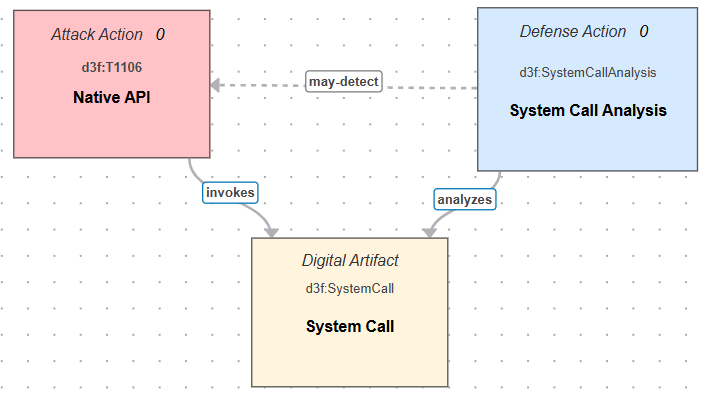
Note that relationships can be added directly between a Defense Action and Attack Action. One can use an abstract value like mitigates for this, but a better, more specific mitigation relationship might be detects or evicts. However, impactful D3FEND graphs require the intermediate digital artifact nodes in place to communicate the why and how behind such relationships. For example, System Call Analysis mitigates Native API (T1106) because this TTP invokes system calls and the countermeasure is defined in the D3FEND ontology as a defensive technique that analyzes system calls. Thus, the System Call digital artifact serves as the link between the TTP and Defense Action.
While it's true that *d3f:SystemCallAnalysis may detect Native API (T1106), it accomplishes this by analyzing the System Calls that the TTP invokes.
Modeling Digital Artifacts
This brings us to modeling Digital Artifacts, which represent the discrete components that attacks or defenses act on, and act as the “glue” of a D3FEND graph. Modeling Digital Artifacts correctly and effectively requires taking a systems engineering perspective to understand how the bits and pieces connect to each other. Remember tip #1 from the previous blog post: When building the Digital Artifact chain, consider artifact provenance. Ask yourself, how did this file, packet, configuration, etc. actually get to the target? As always, if there are necessary relationships or classes that do not exist in the ontology, prepend a colon to its label, e.g., :generates, and the new class will glow green in CAD.
ShadowCat Example
We’ll now go through an example of a D3FEND graph created from the CTI perspective on Operation ShadowCat. This is based on a blog post published by Cyble Research and Intelligence Labs. The full example can be found by navigating to the D3FEND CAD page, and clicking on the shadowcat.json example from the File > Example Graphs menu.
Overview
From Cyble’s blog post, we can gather that Operation ShadowCat was carried out by a Russian-speaking group which utilizes emails with a malicious .LNK attachment as an initial-access vector. The .LNK file then executes a PowerShell command to drop a .NET loader file, whose methods then get invoked to fetch a steganographically encoded PNG image from a C2 server which contains a RAT payload written in Golang. This payload is decompressed and injected into the running PowerShell.exe process, which then enables malicious functionality that supports actions associated with ransomware, reconnaissance, or data exfiltration.
The post also contains detailed snippets of the malware source code, as well as a list of recommendations, MITRE ATT&CK techniques, and Indicators of Compromise, which are commonplace in contemporary CTI reporting. Additionally, Cyble includes a high-level overview diagram of the attack, and a Yara Rule to detect the final Go RAT payload. Overall, the Cyble ShadowCat blog post is an excellent resource that provides detailed information on the attack.
Mapping with CAD
An interactive version of our ShadowCat D3FEND graph can be found below:
D3FEND ShadowCat Example
This D3FEND graph was crafted by analyzing the Cyble blog post from the perspective of a CTI expert, as discussed in the methodology presented above. Our approach can be summarized by the following steps:
We started by modeling the Attack Action nodes using the provided appendix of ATT&CK TTPs.
Next, each attack node (in red) was mapped to a corresponding digital artifact class and sequenced using the “precedes” relationship. In some cases, we utilized the CAD tool’s “explode node” functionality to uncover second-layer inferences about artifacts, providing deeper insights.
We then added some defensive techniques. Here, we utilized the “defend the node” CAD function to leverage the D3FEND ontology to recommend some defensive techniques for the Attack Actions.
Finally, we enriched the graph with some contextual annotations (using the Note node in CAD).
We’d like to highlight several insights that can be gathered from the Shadowcat D3FEND graph created in CAD:
Attack Actions are sequenced and displayed in order of occurrence. Interestingly, we see that the Powershell TTP occurs twice.
It is clear which digital artifacts each TTP acts on and their relationships with each other.
The provided Yara rule effectively detects the Golang ShadowCat RAT, but is only useful late in the attack sequence. A defender may be able to use other Defensive Actions such as email filtering to detect earlier Attack Actions.
In summary, the following benefits are realized when creating D3FEND graphs with the CAD tool:
Consistency in modeling: D3FEND graphs are built using the concepts defined in the D3FEND ontology, ensuring consistent models across different domains.
Accessibility to both humans and machines: D3FEND graphs can be shared and viewed by humans, and also parsed by machines due to their inherent JSON format.
Precise technical details: graphs describe both the what (the technique) and the how (digital artifacts and events) in terms of threats and how they may affect a system.
Enrichment: during the creation of D3FEND graphs, the D3FEND ontology can be used to discover additional digital artifacts and other objects that may add missing or useful context.